data lineage in detail

Know where every number came from.

Every chart, graph and table in Kitewing knows the code that made it, the data sources that originated it, and the prompt that requested it. Never wonder how an agent got a number again.

stage 01 · built from

Every chart knows its lineage.

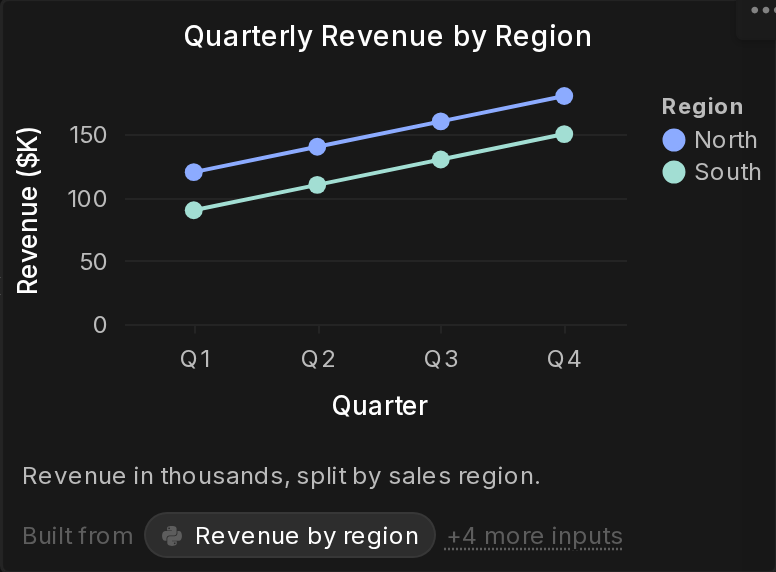
Under every chart and table in a report or dashboard are the datasets it was drawn from, the code and calulations that built it, and the exact prompt that requested it. Look for 'Built from' under any chart, graph or table in Kitewing.

where
reports · dashboards
prints
first input · count of the rest
opens
data lineage
A Kitewing dashboard chart, Quarterly Revenue by Region, with its Built from line: Revenue by region, +4 more inputs

stage 02 · sources

Audit the data the entire org is using.

Every query and every API call is logged and audited. Know at a glance what your team is looking at.

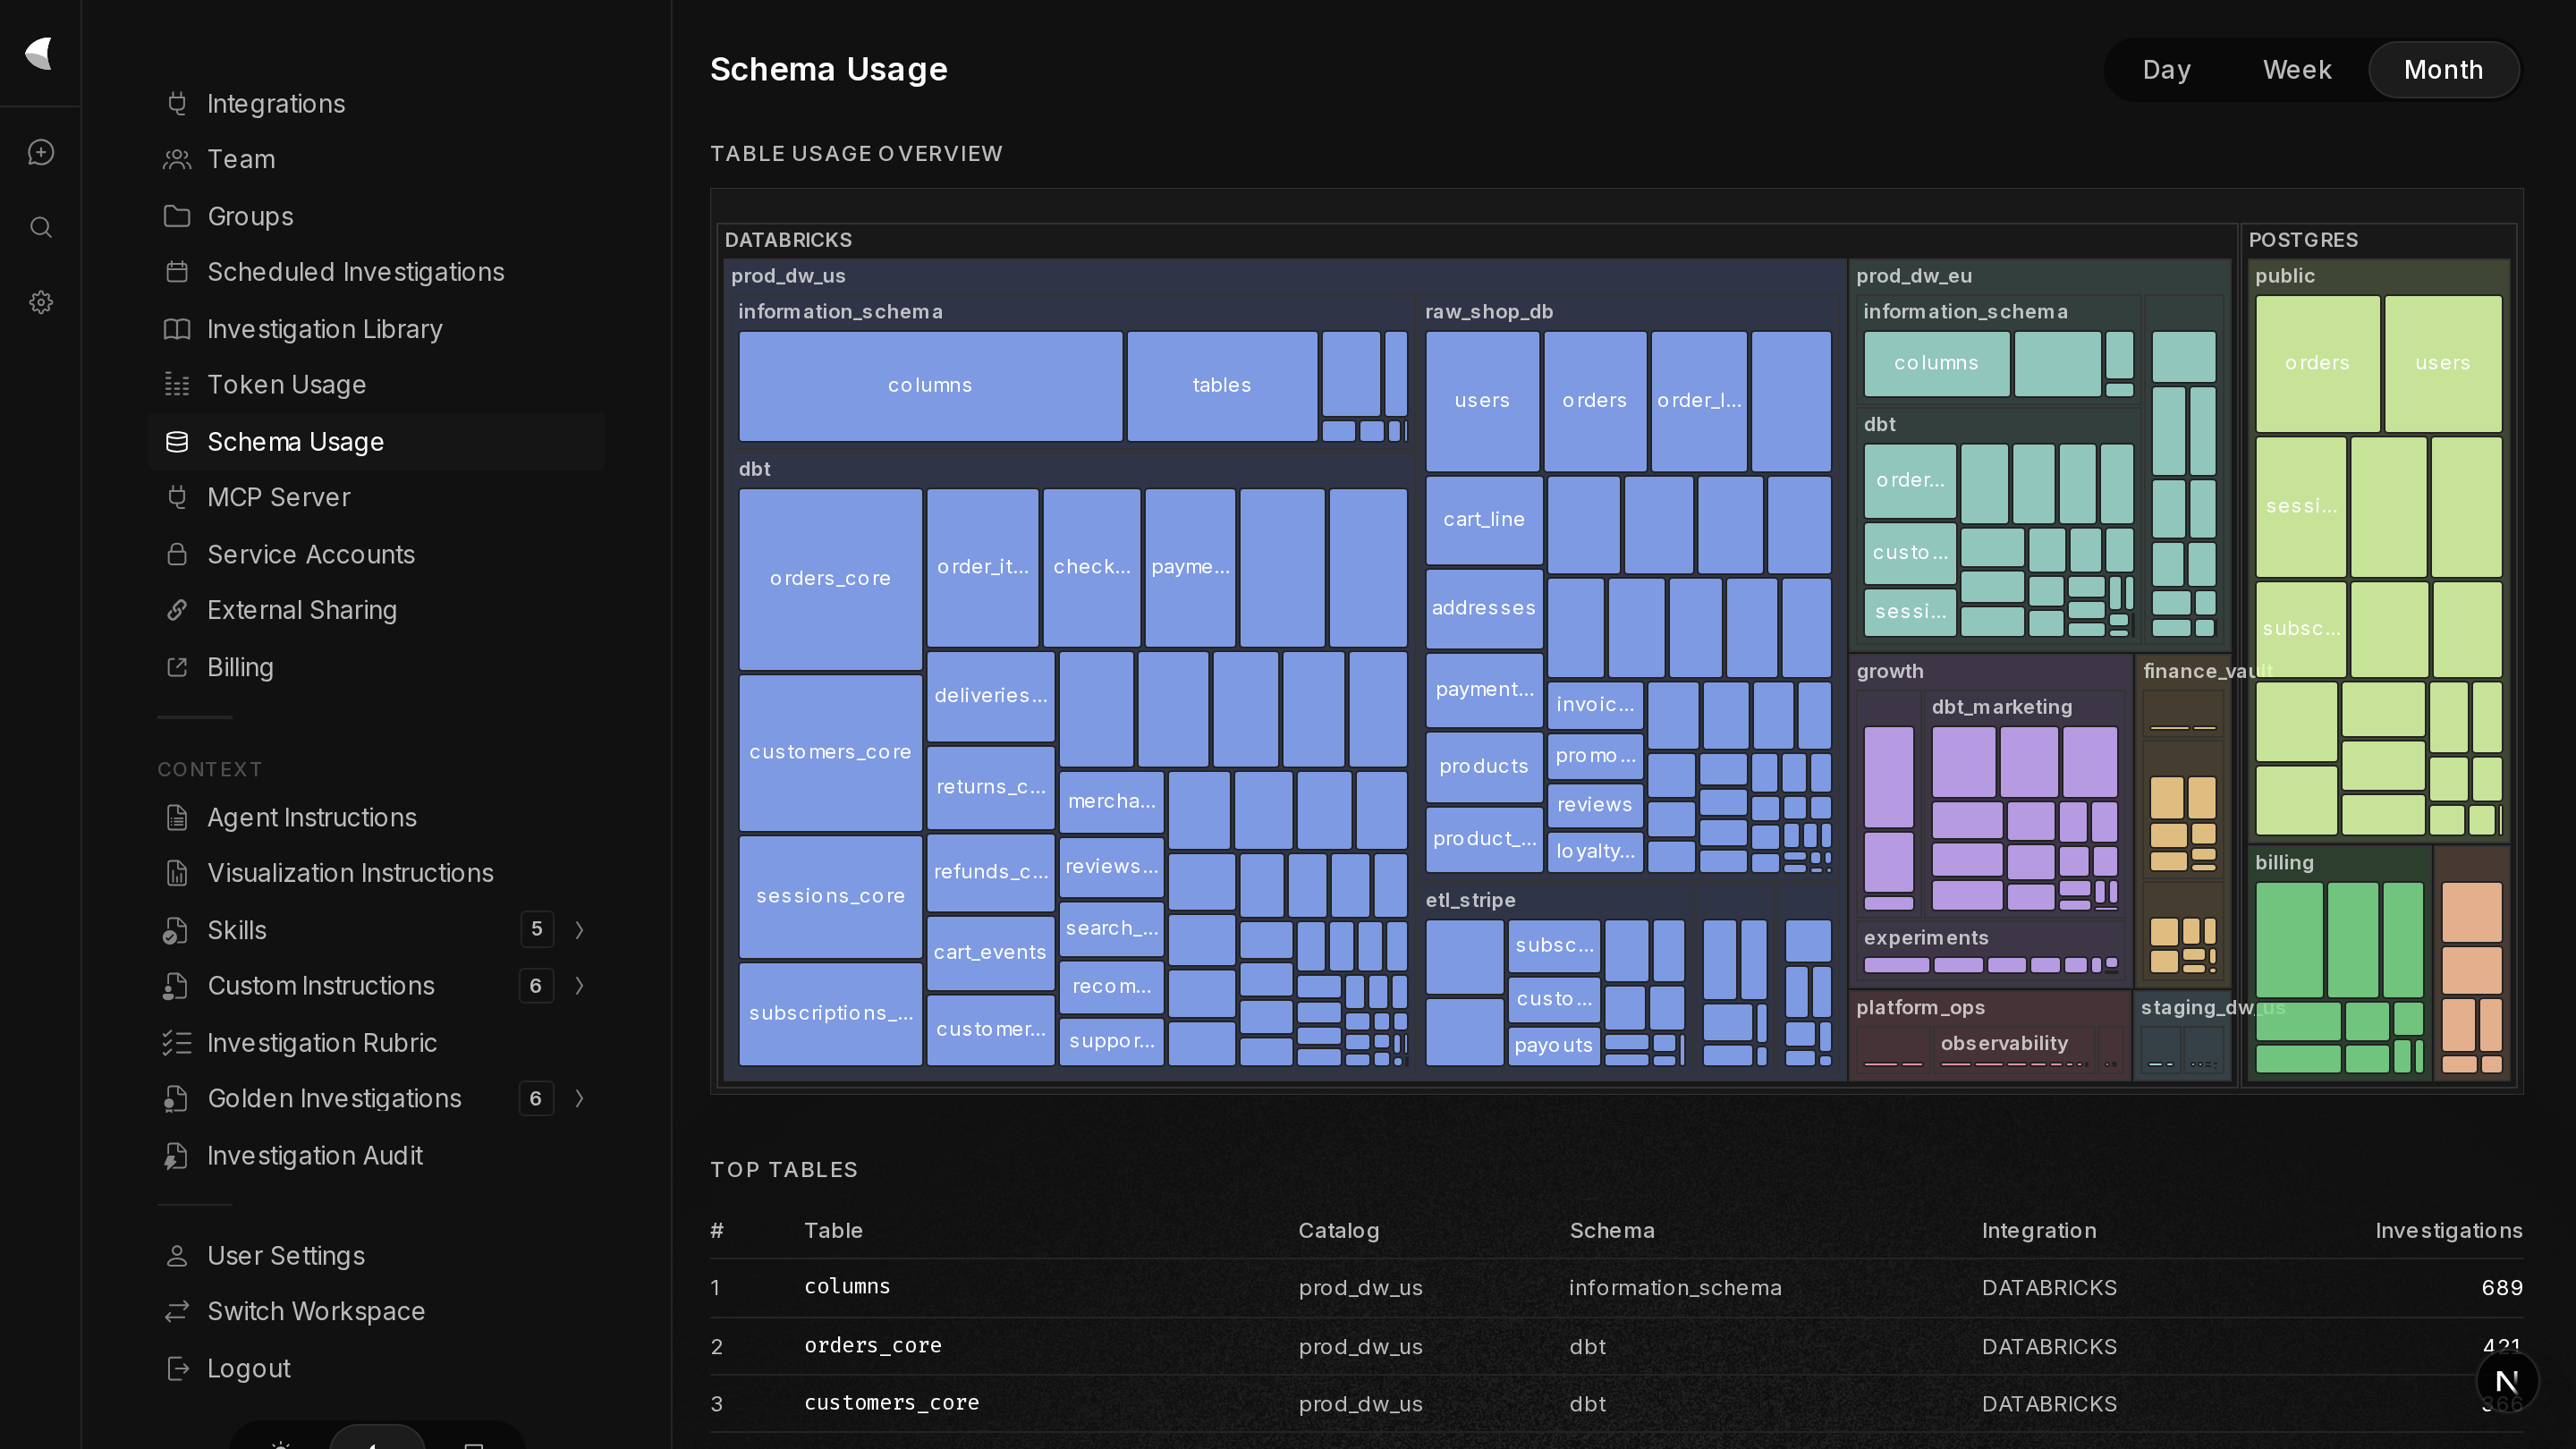
See what data is being used the most, and every piece of data that's ever used. Know instantly if the wrong data is being accessed by users or executives.

view
treemap · day / week / month
ranks
tables by investigations
spans
warehouse · catalog · schema · table
Kitewing's schema usage page: a treemap of every warehouse, catalog, schema and table the agent read this month — Databricks catalogs and a Postgres database — with the top tables ranked by how many investigations touched them

stage 03 · code

The exact code alongside the question that asked for it.

It's not just the data that's audited, it's the calculations. Know the exact math, the filters, the aggregations, and the exclusions. Nothing hidden.

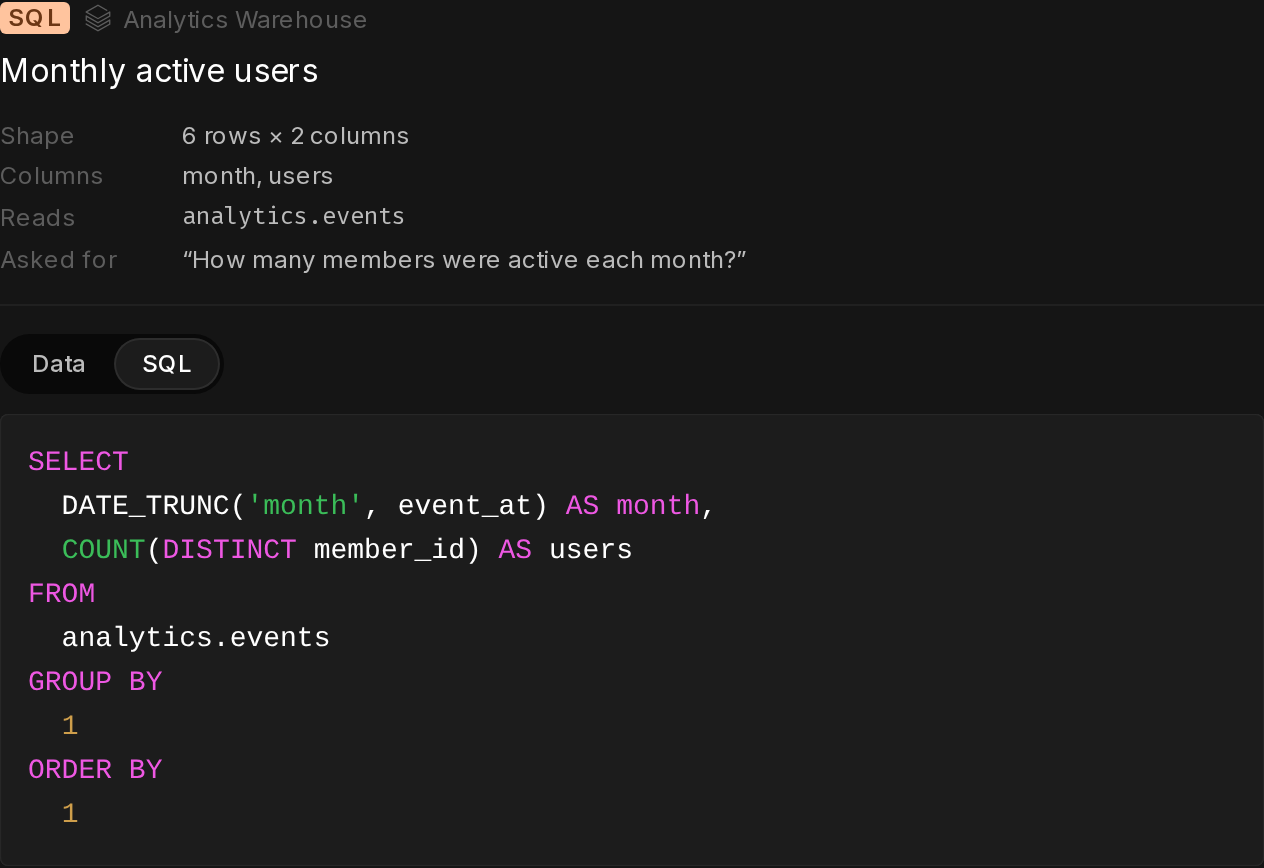
The SQL tab prints the query exactly as it ran. A Python node prints its pandas, with the copy control beside it. When you need to double-check, it's right there.

particulars
shape · columns · reads · asked for
sql
as run · copy
python
as run · copy
The Monthly active users node's detail card in Kitewing's Data lineage modal: shape 6 rows × 2 columns, columns month and users, reads analytics.events, the question asked, and the SQL tab printing the query

stage 04 · rows

The rows themselves, when you need to audit them.

After auditing the query, audit the data that came back too. Be sure of the answers you're getting, and the answers your team is getting.

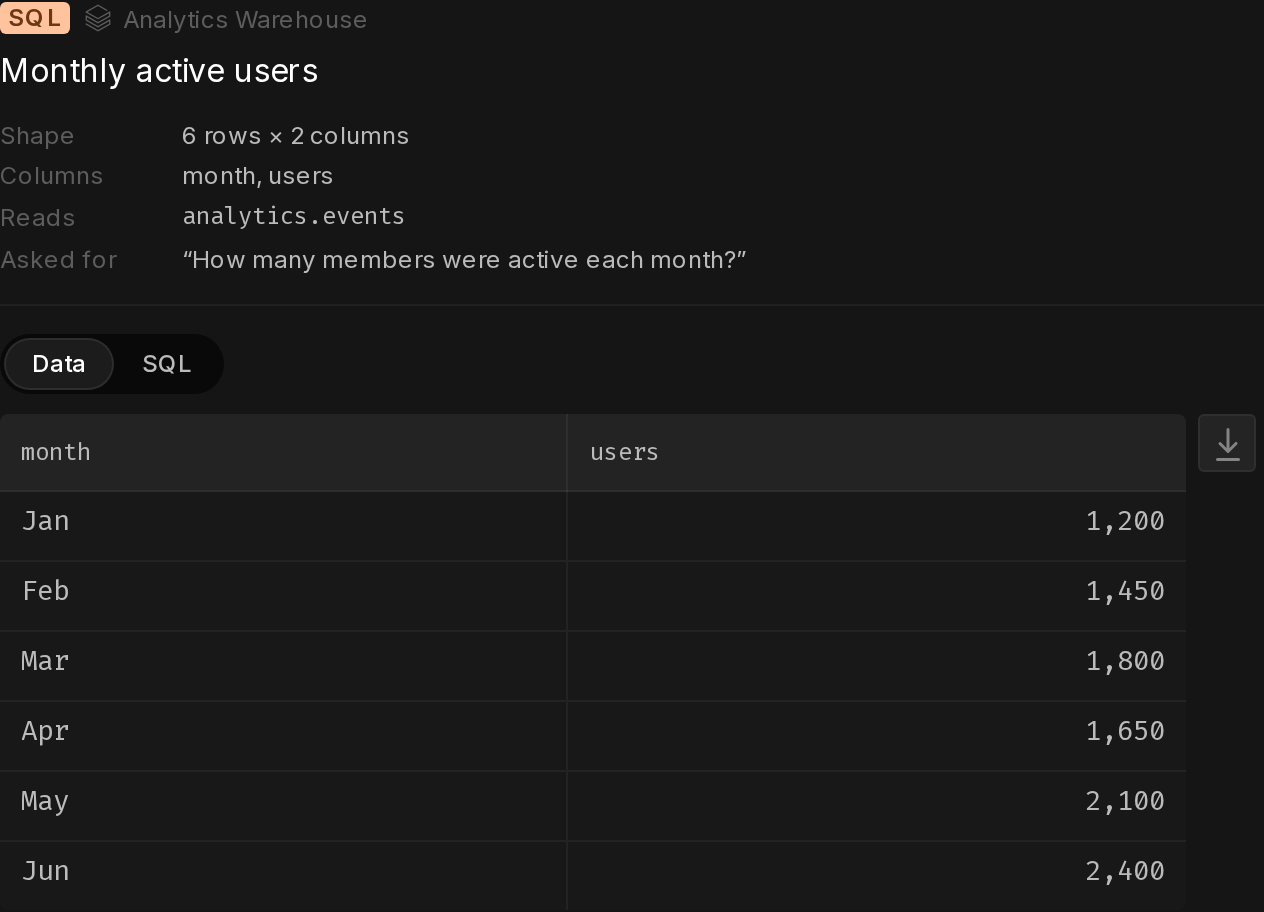
Missing month? Duplicate rows? Suspicious drop? It's all right there. You see what the agent sees, and what the agent does with it.

data tab
every result row
download
the full result set
scope
every dataset node
The Monthly active users node's detail card in Kitewing's Data lineage modal with the Data tab open: six rows of month and users, and the download control